Add math to your R with LaTeX
You may want to incorporate math functions into your R markdown output, whether that be just a set of math questions, math symbols, or add equations to plots. LaTeX is a typesetting language for typing math questions, which is super powerful and fairly easy to use. If you’re new to LateX, I highly recommend checking out the following resources:
In order to use LaTeX in Rmarkdown, you’ll need to have it installed on your computer first: Go here to download
Equations in report
We can do inline equations surrounded by single “$” characters, or do a block equation surrounded by “$$”.
I can display an equation like so \(Y = \beta_0 + \beta_1X_1 + \beta_2X_2 + \beta_3X_3\), or using a block:
\[ Y = \beta_0 + \beta_1X_1 + \beta_2X_2 + \beta_3X_3 \]
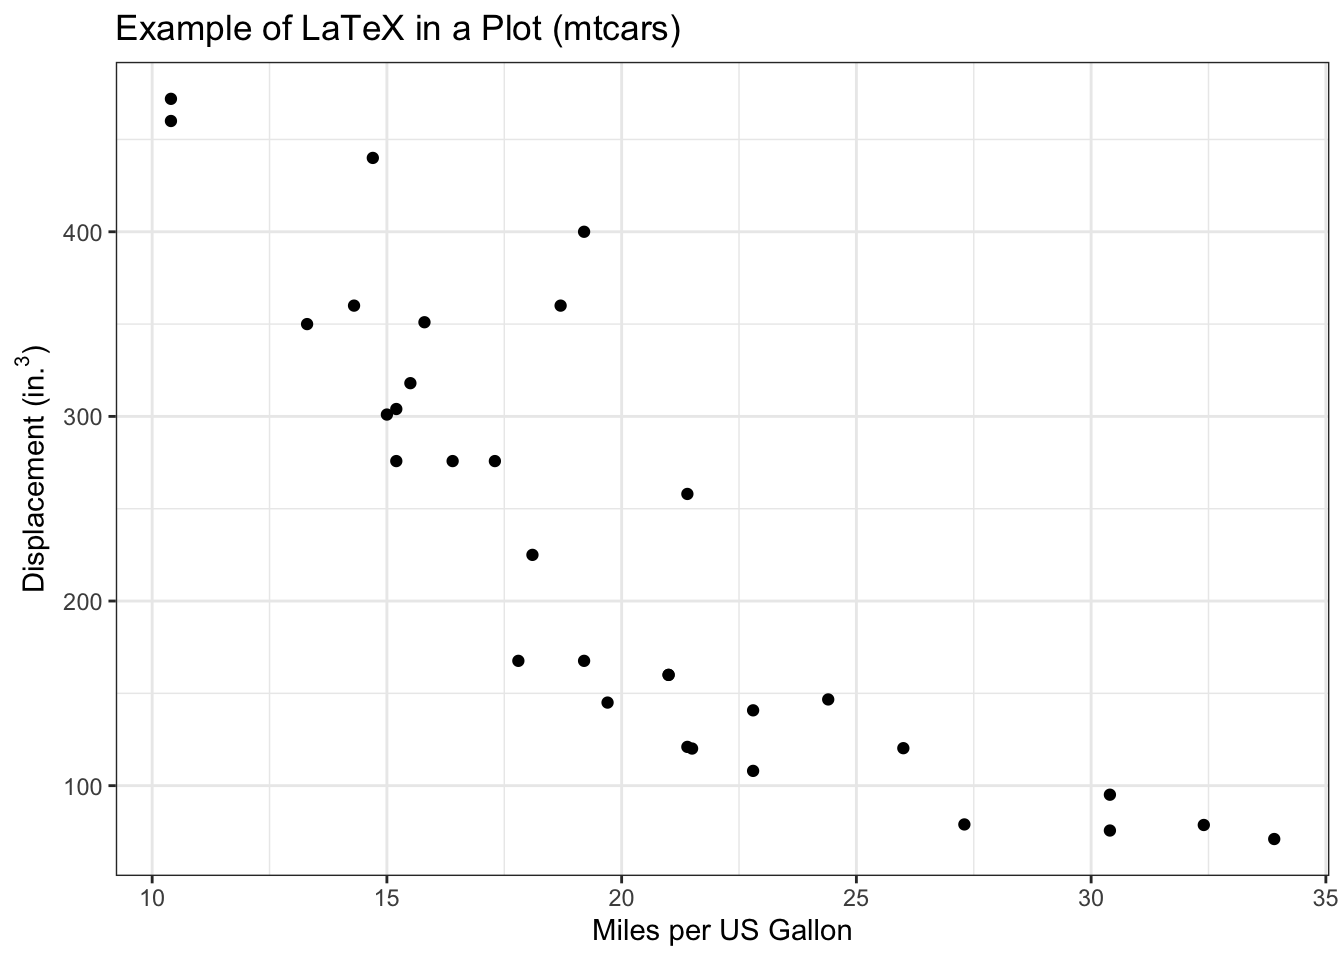
LaTeX in Plot Labels
We can also add LaTeX to plots, using the latex2exp package. The TeX function from this package renders text with inline LaTeX equations.
library(ggplot2)
ggplot(data = mtcars, aes(x = mpg, y = disp)) +
  geom_point() +
  xlab("Miles per US Gallon")+
  ylab(latex2exp::TeX("Displacement ($in.^3$)")) +
  ggtitle("Example of LaTeX in a Plot (mtcars)") +
  theme_bw()